Mortgage Lenders and Administrators Statistics: 2022 Q4
Key findings
- The outstanding value of all residential mortgage loans was £1,675.8 billion at the end of 2022 Q4, 3.9% higher than a year earlier (Table A). footnote [1]
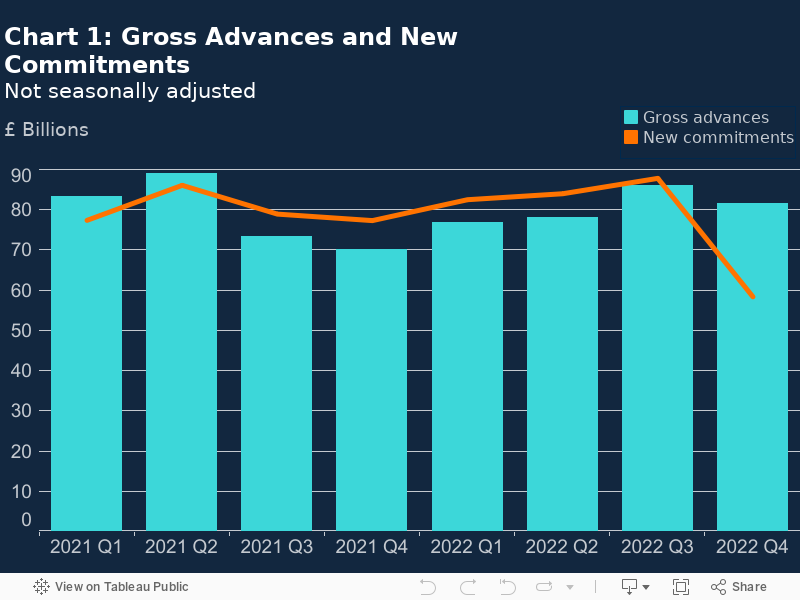
- The value of gross mortgage advances in 2022 Q4 was £81.6 billion, which was £4.3 billion lower than the previous quarter, but 16.3% higher than in 2021 Q4 (Table A and Chart 1).
- The value of new mortgage commitments (lending agreed to be advanced in the coming months) in 2022 Q4 was 33.5% less than the previous quarter and 24.5% less than a year earlier, at £58.4 billion. If the onset of the Covid-19 pandemic and period immediately thereafter is excluded, this was the lowest observed since 2015 Q1 (Table A and Chart 1).
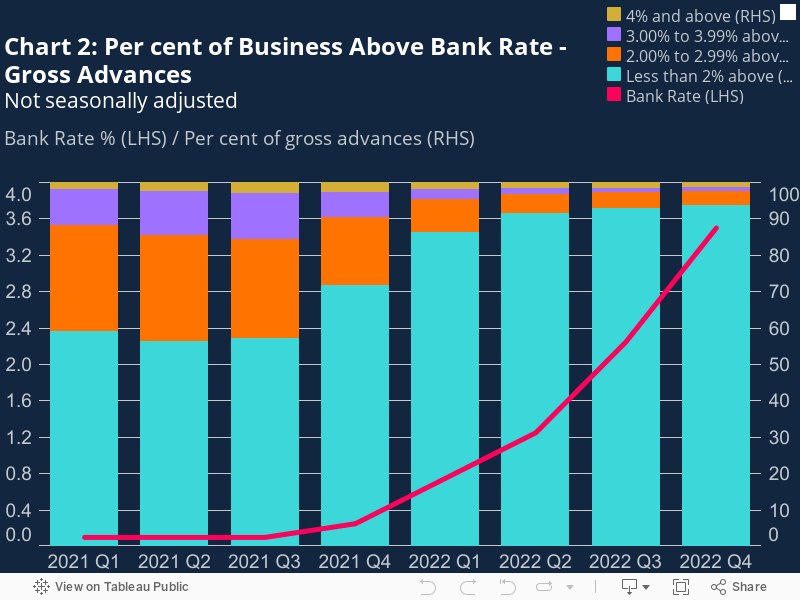
- The share of gross mortgage advances with interest rates less than 2% above Bank Rate was 93.6% in 2022 Q4, 22.0 percentage points (pp) higher than a year ago and the highest seen since 2008 Q2 (Chart 2).
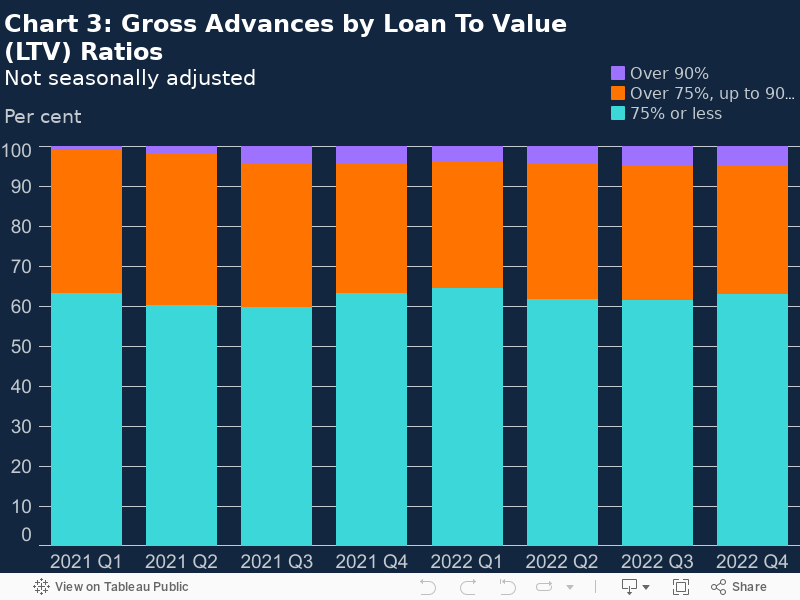
- The share of gross mortgage advances in 2022 Q4 with loan to value (LTV) ratios exceeding 90% was 5.1%, 0.9pp higher than a year earlier and the highest observed since 2020 Q1 (Chart 3).
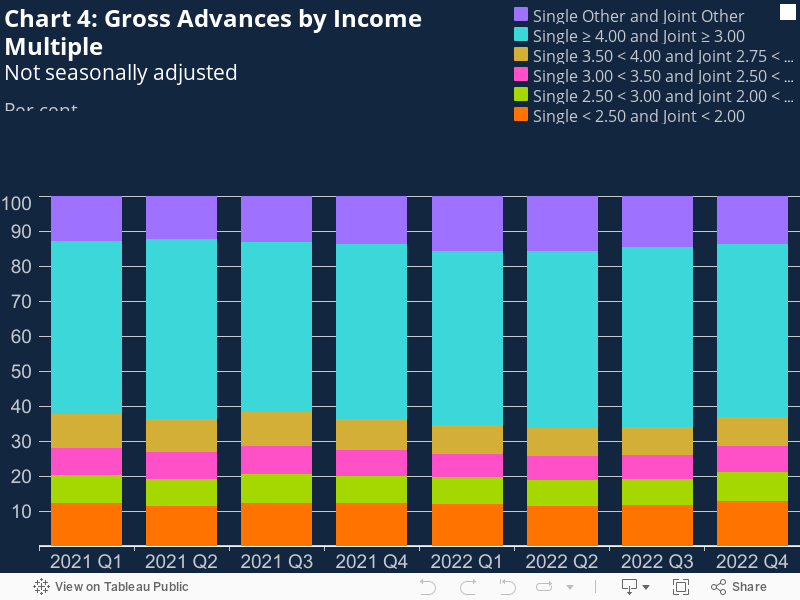
- The proportion of lending to borrowers with a high loan to income (LTI) ratio decreased by 2.2pp on the quarter to 49.3% in 2022 Q4, the lowest seen since 2021 Q3 (Chart 4).
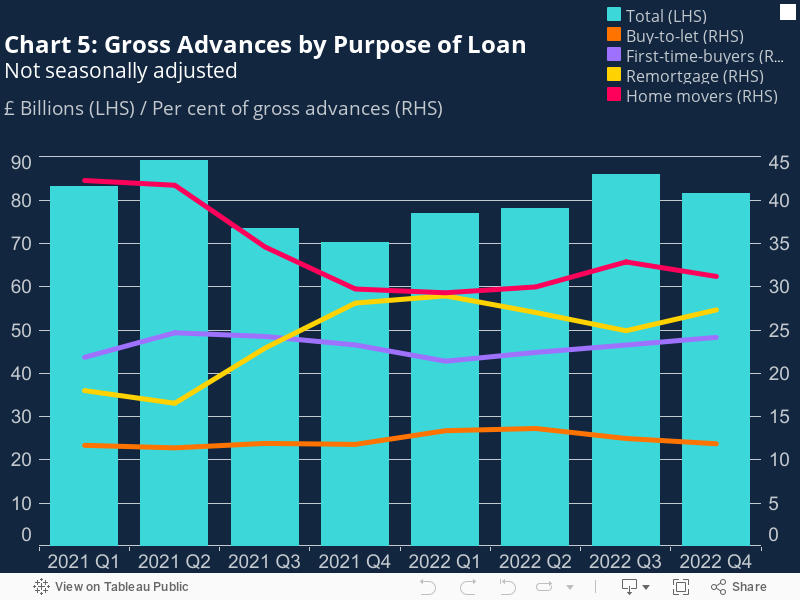
- The share for house purchase for owner occupation was 55.4%, down 0.8pp on the previous quarter, but up 2.3pp from 2021 Q4. The share of gross advances for remortgages for owner occupation was 27.3%, a decrease of 0.8pp since 2021 Q4, but an increase of 2.4pp since 2022 Q3 (Chart 5).
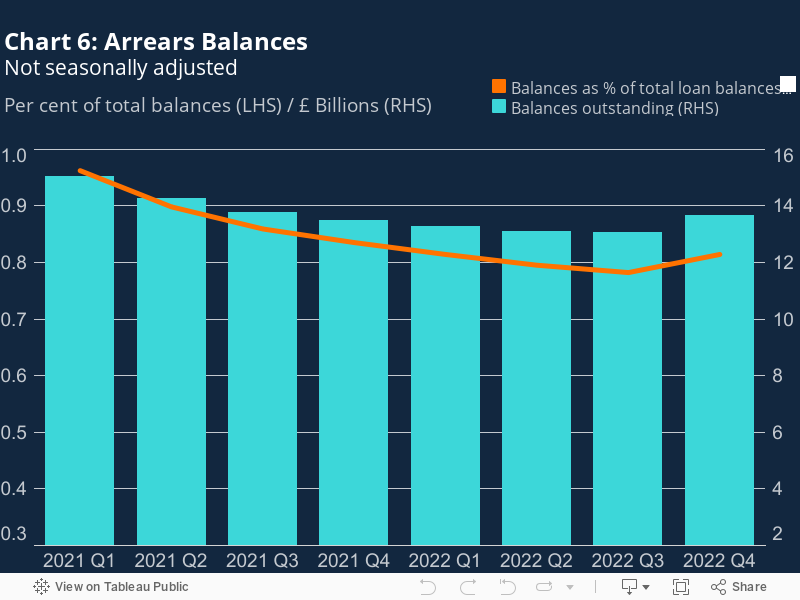
- The value of outstanding balances with arrears increased for the first time since 2021 Q1, by 4.6% over the quarter and 1.3% over the year, to £13.6 billion in 2022 Q4. This now accounts for 0.81% of outstanding mortgage balances, but remains close to the historical low of 0.78% in 2022 Q3 (Chart 6).
Table A: Residential loans to individuals, flows and balances
Regulated and non-regulated mortgages *
£ billions
|
Q1 |
Q2 |
Q3 |
Q4 |
Q1 |
Q2 |
Q3 |
Q4 |
|
|---|---|---|---|---|---|---|---|---|
| 2021 | 2022 | |||||||
| Flows | ||||||||
| Gross advances | 83.2 | 89.1 | 73.4 | 70.2 | 76.9 | 78.0 | 85.9 | 81.6 |
| New commitments | 77.4 | 86.1 | 78.9 | 77.3 | 82.5 | 84.0 | 87.8 | 58.4 |
|
Amounts outstanding |
1,561.6 |
1,587.6 |
1,601.9 |
1,613.5 |
1,630.8 |
1,648.8 |
1,667.1 |
1,675.8 |
Footnotes
Graphical Analysis:
- The value of gross mortgage advances in 2022 Q4 was £81.6 billion, which was £4.3 billion lower than the previous quarter, but 16.3% higher than in 2021 Q4 (Table A and Chart 1). footnote [2]
- The value of new mortgage commitments (lending agreed to be advanced in the coming months) in 2022 Q4 was 33.5% less than the previous quarter and 24.5% less than a year earlier, at £58.4 billion. If the onset of the Covid-19 pandemic and period immediately thereafter is excluded, this was the lowest observed since 2015 Q1 (Table A and Chart 1). footnote [3]
- The share of gross mortgage advances with interest rates less than 2% above Bank Rate was 93.6% in 2022 Q4, 0.7pp higher than last quarter. This was 22.0pp higher than a year ago and the highest seen since 2008 Q2 (Chart 2). footnote [4]
- The share of advances with interest rates between 2% and 3% above Bank Rate decreased over the quarter to 3.8% from 4.2%, while the share of advances with interest rates 3% or more above Bank Rate decreased by 0.3pp to 2.6% from 2022 Q3. footnote [5] footnote [6]
- The share of advances with LTV ratios exceeding 90% remained broadly unchanged from the previous quarter, at 5.1% in 2022 Q4. This was 0.9pp higher than a year earlier, and the highest seen since 2020 Q1 (Chart 3). footnote [7] Within this, the share of mortgages advanced with LTVs over 95% remained at 0.2%. footnote [9]
- The share of mortgages advanced in 2022 Q4 with LTV ratios exceeding 75% decreased by 1.4pp on the quarter to 37.0%, but remained 0.3pp higher than a year earlier. footnote [8]
- The proportion of lending to borrowers with a high loan to income (LTI) ratio decreased by 2.2pp on the quarter to 49.3% in 2022 Q4, 0.8pp lower than a year earlier, and the lowest observed since 2021 Q3 (Chart 4). footnote [10] Borrowers with high LTI are defined here as:
- Borrowers with single income who had a LTI ratio of 4 or above. These loans accounted for 10.6% of gross mortgage lending in 2022 Q4, a 0.6pp decrease compared to the previous quarter. footnote [11]
- Borrowers with a joint income who had a LTI of 3 or above. These loans accounted for 38.7% of gross mortgage lending in 2022 Q4, a 1.6pp decrease compared to the previous quarter. footnote [12]
- The share of gross mortgage advances for buy-to-let purposes (covering house purchase, remortgage and further advance) was 11.9% in 2022 Q4, a fall of 0.6pp on the previous quarter but an increase of 0.1pp from 2021 Q4 (Chart 5). The share of advances to owner occupiers was 88.1%. footnote [13] footnote [14]
- Of the 88.1% of advances for owner occupiers, the share for remortgages was 27.3%, a decrease of 0.8pp since 2021 Q4, but an increase of 2.4pp since 2022 Q3. The share for house purchase was 55.4%, down 0.8pp on the previous quarter but up 2.3pp from 2021 Q4. Further advances and other mortgages (including lifetime mortgages) accounted for 5.4% of gross advances in total. footnote [15] footnote [16] footnote [17]
- Of the 55.4% of advances for house purchases by owner occupiers, lending to first-time buyers was 0.9pp higher than in 2021 Q4, at 24.2% of gross advances. This was also 0.9pp higher than 2022 Q3, and the highest observed since 2021 Q3. The share advanced to home movers increased by 1.5pp on a year earlier, to 31.2%, but was 1.7pp lower than 2022 Q3. footnote [18] footnote [19]
- The value of outstanding balances with arrears (defined as the borrower failing to make contractual payments equivalent to at least 1.5% of the outstanding mortgage balance or where the property is in possession) increased for the first time since 2021 Q1, by 4.6% on the quarter and 1.3% on a year earlier, to £13.6 billion (Chart 6). footnote [20]
- The proportion of total loan balances with arrears also slightly increased on the quarter for the first time since 2021 Q1, from a historical low of 0.78% to 0.81%. footnote [21]
-
Table 1.11 sub table A row 9
-
Table 1.21 sub table C row 1
-
Table 1.21 sub table C row 3
-
Table 1.22 sub table C row 3 (less than 2% above)
-
Table 1.22 sub table C row 4 (2.00% to 2.99% above)
-
Table 1.22 sub table C row 5 + row 6 (3% or more above)
-
Table 1.31 sub table C row 19 + row 20
-
Calculated as 100% of all mortgages less those <=75% LTV (Table 1.31 sub table C row 21 - row 17)
-
Table 1.31 sub table C row 20
-
Table 1.31 sub table C row 5 + row 13
-
Table 1.31 sub table C row 5
-
Table 1.31 sub table C row 13
-
Table 1.33 sub table C row 4 (buy-to-let)
-
Calculated as 100% of all mortgages less those for buy-to-let purposes (100% - Table 1.33 sub table C row 4) (owner-occupation)
-
Table 1.33 sub table C row 6 (remortgage)
-
Table 1.33 sub table C row 2 + row 3 (house purchase owner occupation)
-
Table 1.33 sub table C row 5 + row 9 (further advance and other)
-
Table 1.33 sub table C row 2 (first-time buyers)
-
Table 1.33 sub table C row 3 (home movers)
-
Table 1.7 sub table C row 10
-
Table 1.7 sub table C row 11